It’s Monday morning. You’ve got your ☕️, you open your 💻, and you head straight to Google PageSpeed Insights.
You plug in your store’s home page URL. You wait. The wheel spins to analyze the page.
And then, Green. A score of 92 on mobile 👏
You feel a wave of relief with such a great score. You’ve spent weeks nagging your dev team (or wrestling with your Shopify theme settings) to minify CSS, defer JavaScript, and compress those high-res hero images. The tool says your site is fast with such a great score.
So why does your Meta Ads Manager tell a different story? 🤔
Why is your bounce rate on product pages still hovering around 65%? Why are session durations short? Why does it feel like you’re pouring money into the top of the funnel, only for it to leak out the moment a customer tries to browse your catalog?
Here is the uncomfortable truth that most agencies won’t tell you: Your PageSpeed score is a simulation. Your customer’s frustration is real.
If you are running a D2C fashion or apparel brand on Shopify, there is a massive disconnect between the “Lab Data” you see in testing tools and the actual experience of a shopper on a 4G connection in Mumbai or Bangalore.
Today, we are going to dismantle the myth of the “Perfect Score” and look at the only speed metric that actually impacts your bottom line and revenue: Real-User Journey Speed.
The Great Illusion: Lab Data vs. Field Data
First, to understand why your store feels slow despite a high score, you have to understand how tools like Google PageSpeed Insights (PSI) actually work.
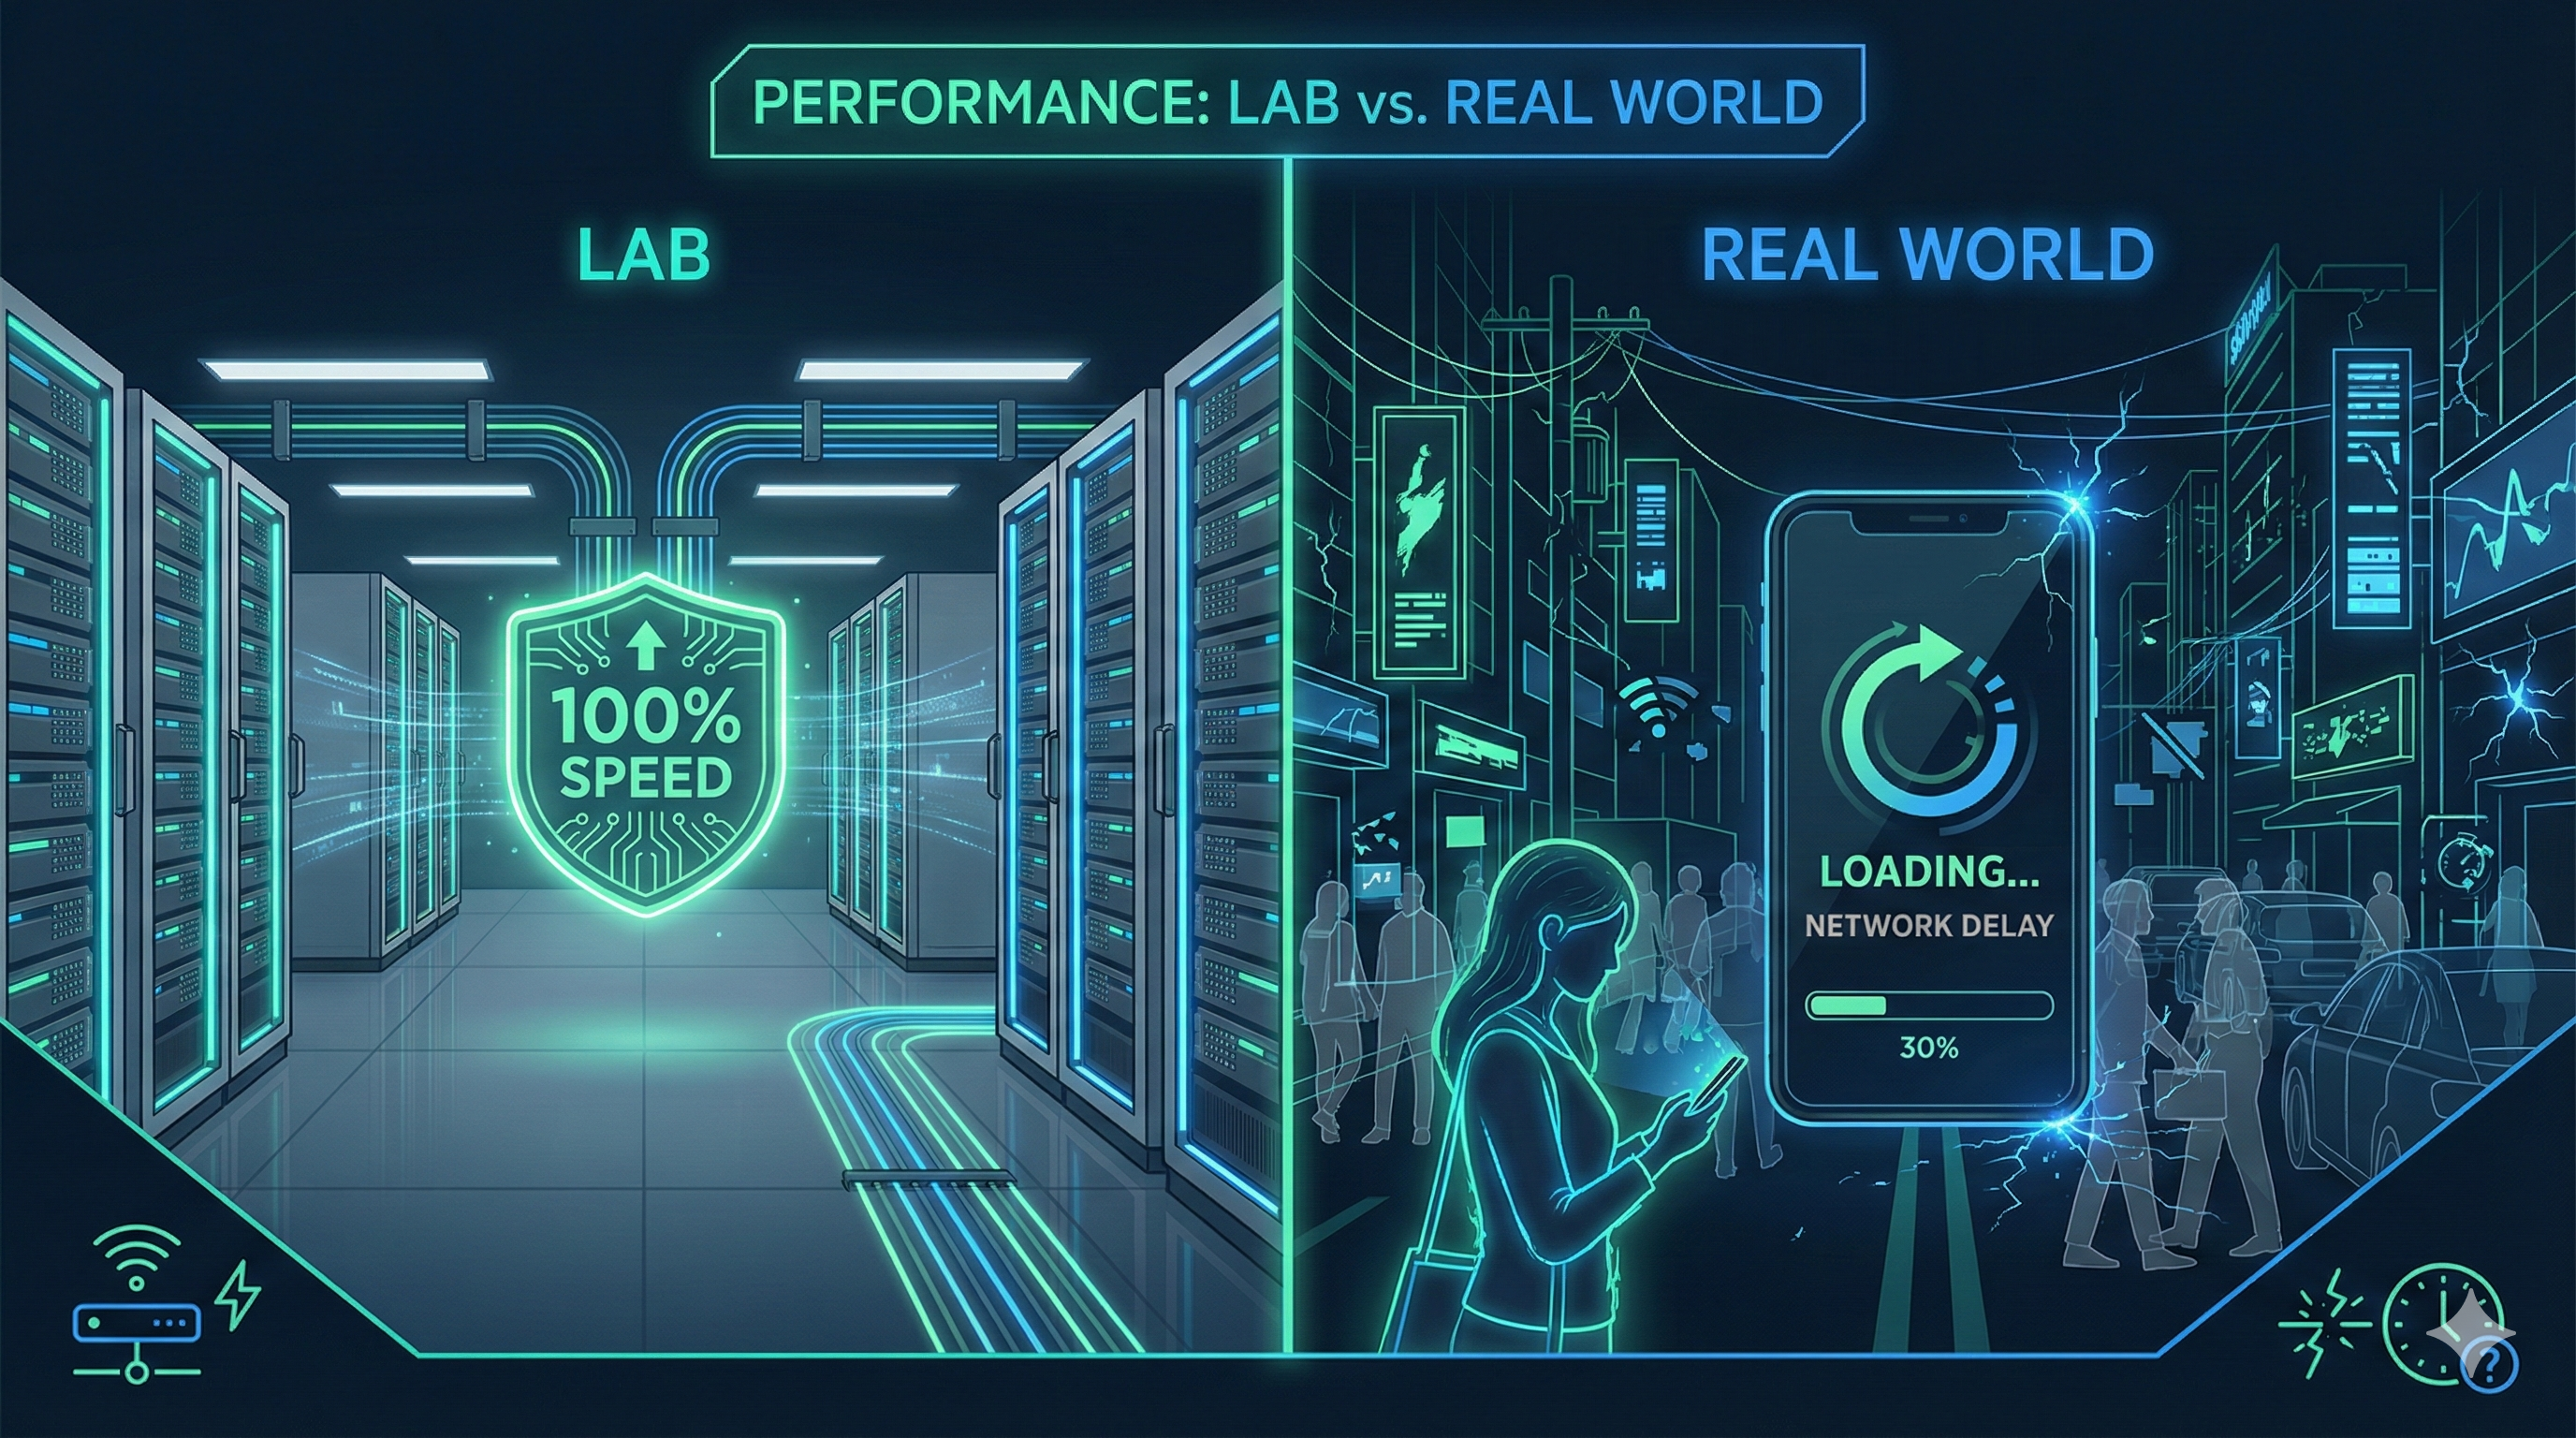
PSI provides two types of data: Lab Data and Field Data.
Lab Data is a simulation. It is a test run performed by a bot, often on a simulated fast network, in a controlled environment. It’s like testing a Ferrari on a treadmill in an air-conditioned garage. Of course, it’s going to perform perfectly. There is no wind resistance, no potholes, and no traffic.
Field Data, on the other hand, is the commute during rush hour. It is aggregated data from real Chrome users who have visited your online store. It accounts for:
- Budget Android devices with slow processors.
- Spotty 5G/4G mobile networks which has faster speed than 3G but still not good enough for quickly loading HD images
- Background apps eating up the user’s RAM. Users keep switching the apps and memory is always filled up
- Real-world latency.
For D2C founders, relying on Lab Data is dangerous. It gives you a false sense of security. You might be optimizing your homepage to load in 0.8 seconds for a bot, while your actual customers are staring at a white screen for 4 seconds every time they click “View Product.”
Why Shopify Stores Struggle Specifically
Shopify is an incredible platform, but it has a specific architecture. It is dynamic.
When a user lands on your fashion store, they aren’t just reading text. They are loading high-resolution images of fabrics, scripts for your review app, the chat widget, the personalization engine, and the analytics trackers you use to retarget them later.
In a “Lab” environment, these might load sequentially and smoothly. In the “Field,” particularly on mobile devices, these scripts compete for bandwidth.
If you want to dive deeper into why this specific architecture hurts your conversions, I recommend reading about The Hidden Post-Click Problem Killing Your D2C Conversions.
The “Post-Click” Graveyard: Where Conversions Go to Die
Most founders obsess over the Homepage Load Time. It makes sense; it’s the front door.
But ask yourself: Do you make money on the homepage?
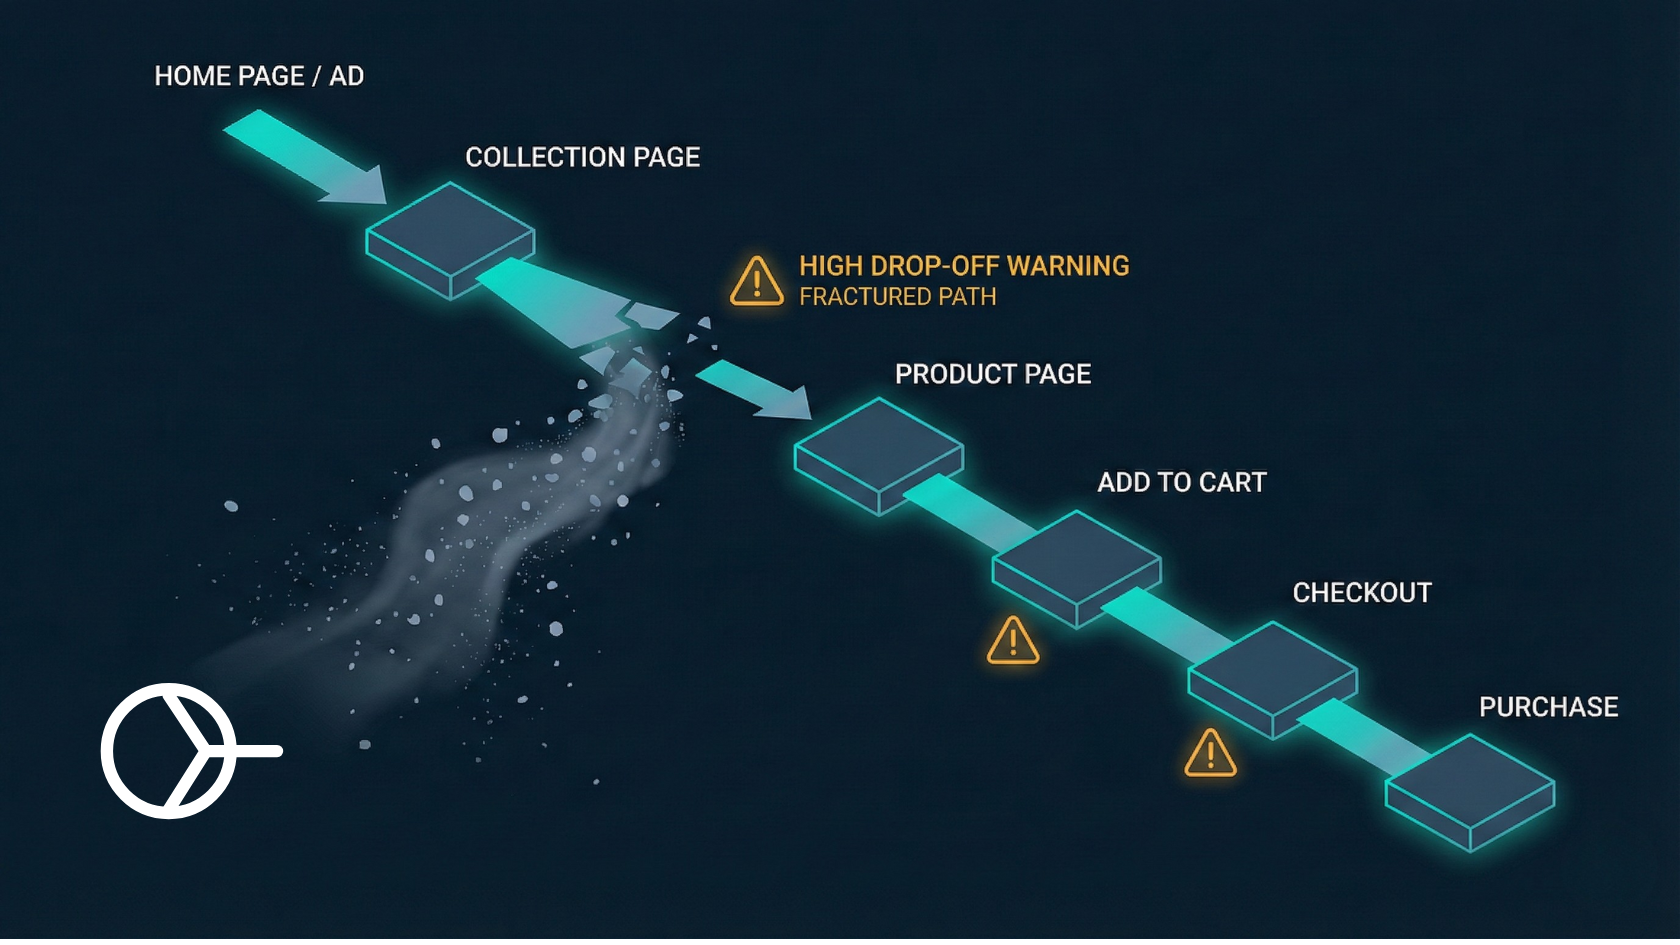
No. You make money when a user navigates from a Collection Page (PLP) -> Product Page (PDP) -> Add to Cart -> Checkout.
This is the User Journey. And this is where the “PageSpeed Score” fails you completely.
PageSpeed Insights usually tests a single URL (often the homepage) in isolation. It treats the page visit as a one-time event. But shopping is a flow.
The 60% Drop-off Reality: Data suggests that over 60% of potential sales are lost between clicks.
Imagine a shopper, Aisha. She clicks an Instagram ad and lands on your collection page. She sees a dress she likes. She taps the image.
…Wait… (1 second) …Wait… (2 seconds) …White screen… (3 seconds)
In that 3-second gap, Aisha forgets the excitement of the dress and remembers she has 50 other Insta stories to catch-up. She swipes back to Instagram. You just paid ₹50 for that click, and you lost her because of Post-Click Latency.
Lab tests don’t measure the friction between pages. They don’t measure how the “vibe” of your brand is destroyed when a seamless Instagram experience turns into a clunky, slow mobile website. Instead of obsessing over lab scores, you should be tracking Checkout Velocity Boost, which measures the cumulative time saved across the entire buyer journey.
CrUX: The Source of Truth
If you want to know how fast your store actually is, stop looking at the top big number on PageSpeed Insights. Scroll down to the section labeled “Discover what your real users are experiencing.”
This is your Chrome User Experience Report (CrUX) data.
This data comes from the last 28 days of actual traffic. It will tell you your Core Web Vitals:
- LCP (Largest Contentful Paint): How long until the main image shows up?
- INP (Interaction to Next Paint): When they click a button, does the site react instantly or freeze?
- CLS (Cumulative Layout Shift): Does the content jump around while loading?
Google uses this data (Field Data) for SEO ranking, not your Lab score. If your Lab score is 90 but your Field LCP is 4 seconds, Google considers your site slow.
You can verify this inside your own Google Search Console.
The Solution: Stop Optimizing, Start Predicting
So, you’ve realized your Lab Score is a vanity metric. You know real users are suffering on mobile. What do you do?
You could try to strip down your theme, remove all your apps, and compress your images until they look like pixel art. But you run a fashion brand where visuals are everything. You need those high-res images to show product detailing. You need those review apps.
The traditional approach to speed is reactive: User clicks -> Server receives request -> Server thinks -> Server sends data -> Browser loads.
This loop takes time. On a 4G network, it takes too much time.
The modern approach, used by giants like Instagram and Amazon, is predictive.
Enter Predictive Prefetching
Imagine if your website knew what the user was going to click before they clicked it.
If a user is hovering over that red dress on the collection page, there is a high probability (often over 80%) that they will visit that product page next.
Predictive Prefetching technology, like the engine powering Smart Prefetch uses AI to analyze these behavioral signals.
- Analyze: The AI watches user behavior (cursor movement, scroll depth, dwell time).
- Predict: It identifies the most likely next link.
- Prefetch: It loads that next page in the background (browser cache) while the user is still thinking.
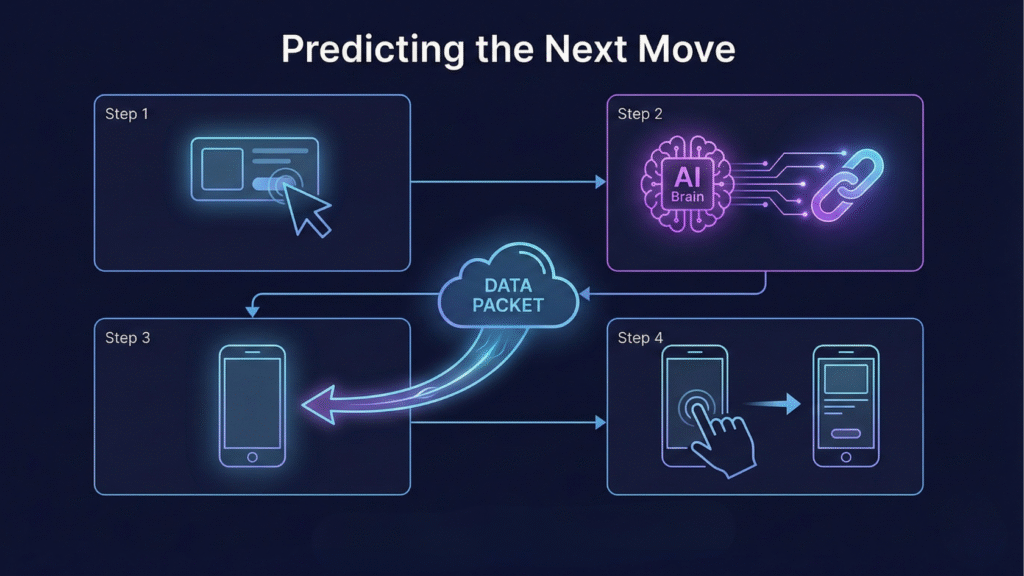
When the user finally does tap the image, the content is already there. The page doesn’t “load” from your server; it appears immediately.
This completely bypasses the network latency issue. It doesn’t matter if the user is on 4G or if your server is taking 500ms to respond, because the heavy lifting was done before the click happened.
This is how you solve the “Post-Click” problem. You don’t make the road smoother; you teleport the user to the destination.
Why Journey Speed > Page Speed
For a founder like you, Rohan, the metric that matters isn’t “Homepage Load Time.” It is Revenue Per Session.
A faster journey encourages exploration. When pages load instantly, users view more products. They browse more variants. They are less likely to get distracted.
- Traditional Speed Optimization: Saves milliseconds on the initial load. Good for First Impressions.
- Predictive UX (Smart Prefetch): Saves seconds on every subsequent click. Critical for Conversion.
We are facing a Traffic ROI Crisis. Ad costs are rising. You cannot afford to lose 60% of your paid traffic because of a 2-second delay between pages.
If you are curious about the financial impact of these delays, I’ve broken down the math in our guide below-

Conclusion: Take off the Lab Coat
It is time to stop celebrating vanity metrics. A green score on PageSpeed Insights feels good, but it doesn’t deposit money into your bank account.
Your customers are out there in the real world, on buses, in cafes, and on spotty mobile data connections, trying to buy your products. Don’t let a “perfect” lab score blind you to their struggle.
Shift your focus from “Page Speed” to “Shopper Speed.” Focus on the flow. Focus on the feeling of the site.
If you want to diagnose exactly where your speed leaks are happening and how they correlate to your revenue, you need to look at the right data.
Want to see how much money slow post-click speed is costing your D2C brand?
Run your free Speed & Conversion Scorecard and get instant insights into your real-world performance.